
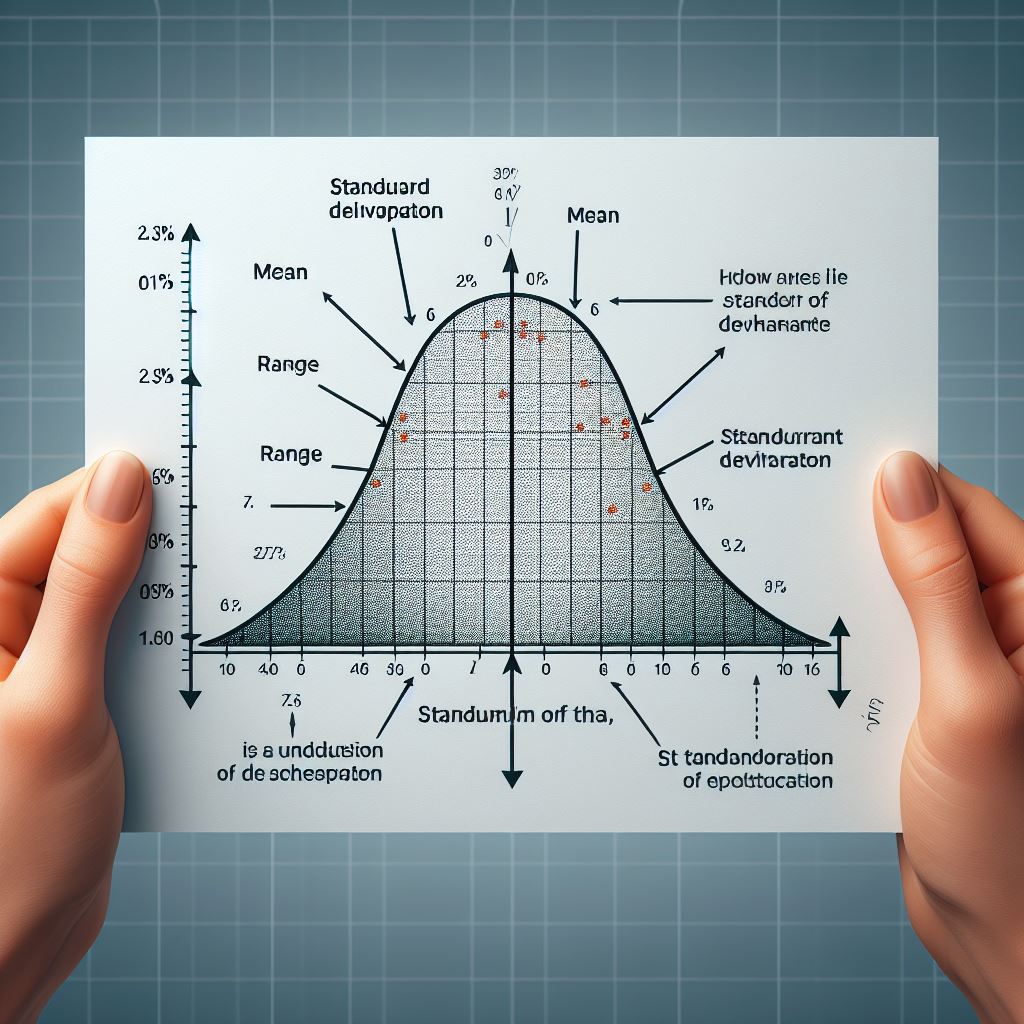
When it comes to analyzing data and understanding the variability within a dataset, standard deviation is a fundamental statistical concept that plays a crucial role. Standard deviation provides valuable insights into how data points are dispersed or spread out around the mean (average) of the dataset.
In this article, we’ll cover what standard deviation is, how it’s calculated, and why it’s essential in various fields, including finance, science, and data analysis
Understanding Variability
Before we dive into standard deviation, let’s first grasp the concept of variability in data. Variability refers to the extent to which individual data points in a dataset deviate from the central value, usually represented by the mean. In simpler terms, it measures how much the data points vary from the average.
Imagine you have two datasets:
Dataset A: [5, 5, 5, 5, 5]
Dataset B: [1, 2, 3, 7, 8]
Both datasets have the same mean (average), which is 5. However, when you look at Dataset A, you can see that all the values are identical and very close to the mean, while Dataset B has values that are more spread out. Standard deviation helps us quantify this difference in variability.
Defining Standard Deviation
Standard deviation is a statistical measure that quantifies the amount of variation or dispersion in a set of data values. It provides a numerical value that indicates how much individual data points differ from the mean. Standard deviation of a dataset is:
- high if many values are far from the mean
- low if they are close to the mean.
- zero, it means that all numbers in the data set are equal.
Mathematically, the standard deviation (often denoted as σ for populations and s for samples) is calculated as follows:
- Calculate the mean of the dataset
- Subtract the mean from each value in set
- Square the values found in the second step and sum all the values
- Divide the sum by the number of values in set
- Take the square root of the last result
Formula: SD = √(Σ(x – μ)^2 / n)
For:
- x is a data in set,
- μ is the mean,
- n is the number of values in set,
- Σ is the sum of
For example, for a given set of 2,6,7
- mean: (2 + 6 + 7) / 3 = 5
- SD = (2-5)^2 + (6-5)^2 + (7-5)^2 = 14
- SD = √ (14 / 3)
- SD = 2.160…
Standart Deviation: Sample vs Population
When working with standard deviation, there is an important point that the distinction between two common scenarios: calculating standard deviation for a sample and calculating it for an entire population.
Population standard deviation, denoted as ‘σ’ (sigma), is used when you have access to data from the entire population you’re interested in.
On the other hand, sample standard deviation, denoted as ‘s,’ is used when you’re working with a subset or sample of data from a larger population. It’s essential to calculate sample standard deviation when you cannot obtain data from the entire population due to time, cost, or logistical constraints
When you want to calculate the sample standard deviation of a dataset, the formula undergoes a minor change. The key difference in the formula for sample standard deviation is the denominator, which is ‘(n – 1)’ rather than ‘n.’ This correction factor, known as Bessel’s correction, adjusts for the fact that you’re estimating the population standard deviation from a sample, making the estimate more accurate.
SD = √(Σ(x – μ)^2 / (n-1))
The new standart deviation for the set above will be :
- SD = √ (14 / 2)
- SD = 2.645
Different Usages Of The Standard Deviation
Standard deviation enables us to make general conclusions from a smaller sample drawn from a large data set. It also is very powerful measure in combination with other statistical measures.
For instance, in psychology studies, standard deviation can be utilized to analyze test scores of a sample of the entire population, allowing us to make generalizations about the overall situation of the population.
And also, standard deviation is a key component of many probability distributions, including the normal distribution. This allows for the calculation of probabilities and confidence intervals, which can be used in statistical inference and hypothesis testing.
The other example is from finance. If you’re an investor, you want to know how likely your investments are to swing wildly in value. A high standard deviation in your portfolio indicates a riskier investment, with the potential for significant ups and downs.
A Practical Example
Imagine you are a psychology researcher studying the performance of students on a standardized psychology test. You want to understand not only the average score but also how much individual scores vary from the mean, as this can provide insights into the students’ performance consistency.
Step 1: Collecting Test Scores
You collect test scores from a sample of 20 students who took the psychology test. Here are their scores:
- Student 1: 78
- Student 2: 82
- Student 3: 75
- Student 4: 89
- Student 5: 91
- Student 6: 76
- Student 7: 83
- Student 8: 87
- Student 9: 80
- Student 10: 79
- Student 11: 88
- Student 12: 85
- Student 13: 81
- Student 14: 77
- Student 15: 84
- Student 16: 86
- Student 17: 72
- Student 18: 90
- Student 19: 73
- Student 20: 74
Step 2: Calculating the Mean
First, you calculate the mean (average) test score of the 20 students:
Mean Score (x̄) = (78 + 82 + 75 + 89 + 91 + 76 + 83 + 87 + 80 + 79 + 88 + 85 + 81 + 77 + 84 + 86 + 72 + 90 + 73 + 74) / 20 = 81.4
Step 3: Calculating Standard Deviation
You use the standard deviation formula to calculate the variability plugging in the values:
- For Student 1: (78 – 81.4)² = 11.56
- For Student 2: (82 – 81.4)² = 0.16
- For Student 3: (75 – 81.4)² = 40.96
- …
After calculating the squared differences for all 20 students, you sum them up:
Σ(xi – x̄)² = 590.2
Now, divide by (n – 1), where ‘n’ is the number of data points (20):
s = √(590.2 / 19) ≈ 5.77
Step 4: Interpreting Standard Deviation
The calculated standard deviation (s) is approximately 5.77. This value tells you that, on average, individual students’ test scores deviate from the mean score of 81.4 by about 5.77 points.
In a psychological context, this information is valuable. A lower standard deviation suggests that the students’ test scores are relatively close to the mean, indicating consistency in their performance. Conversely, a higher standard deviation would suggest greater variability in test scores, potentially indicating differences in the students’ understanding of the material or test-taking abilities.
Does Standard Deviation Reveal Everything?
Standard deviation is a valuable statistical measure, but it doesn’t tell us everything about a dataset.
What It Doesn’t Tell
1. Outliers
Standard deviation might downplay the impact of extreme values, known as outliers. If your dataset has outliers, the standard deviation might not adequately represent the overall data distribution, as it’s sensitive to these extreme values.
2. Data Distribution
It doesn’t provide a complete picture of the data’s distribution shape. For example, two datasets with the same standard deviation can have entirely different distributions—one could be symmetric, while the other might be skewed.
3. Data Relationships
Standard deviation doesn’t capture relationships between variables. It focuses on individual variable variability, making it inadequate for understanding complex interactions or correlations among multiple variables.
4. Context
Context matters. Standard deviation alone may not provide meaningful insights without considering the specific context of the data and its domain. A low standard deviation might be acceptable in one scenario but problematic in another.
The Bigger Picture
To gain a comprehensive understanding of data, it’s often necessary to complement standard deviation with other statistical measures and data visualization techniques. Histograms, box plots, correlation coefficients, and domain knowledge all play crucial roles in uncovering patterns, trends, and outliers that standard deviation might overlook.
In essence, while standard deviation is a valuable tool in statistics, it’s just one piece of the puzzle. To grasp the full story that data has to tell, we need to explore it from multiple angles and consider the broader context in which it exists.
Conclusion
In conclusion, standard deviation is a critical concept in statistics that allows us to quantify and understand the variability within datasets. It has wide-ranging applications across various fields and is a fundamental tool for making informed decisions based on data analysis.
Thank you for reading.